How do plant and dairy milks compare on nutritional value?
Some milks have higher nutritional content than others. So, what does this mean in environmental terms?
Cow’s milk has the highest calories and protein content per serving (240ml). You’d need to consume about one and half times more soya or oat milk than cow’s to get the same amount.
But even once you’ve scaled the figures for this, oat and soya milk are still doing much better than cow’s milk in environmental impacts.
Plant and dairy milk compared by protein and calories
| |
Calories per 240ml |
Protein per 240ml |
| Cow milk |
149 |
7.5 g |
| Oat milk |
130 |
4 g |
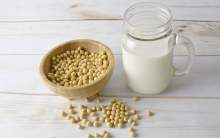
| Soya milk |
100 |
7 g |
| Almond milk |
60 |
1 g |
| Rice milk |
120 |
1 g |
Figures from ‘A Comparison of the Nutritional Value of Cow's Milk and Nondairy Beverages’
Oat milk would require 85% less land and freshwater for the same amount of protein and calories. Soya milk would require around 90% less land and almost 95% less water. Both would have about 50% lower carbon footprint.
For rice and almond milk, it’s a slightly more complex picture. They are considerably lower environmental impact options than cow’s milk when it comes to consuming calories – around 50% lower in terms of carbon emissions and 90% lower for land use. However, they fare much less well when it comes to protein. They would in fact have higher carbon and water footprints than cow’s milk, if you were trying to get the same amount.
If you want to find the milk with the lowest environmental impact compared to nutritional value, soya or oat would definitely be the ones to go for.
In our view, though, switching to any plant-based milk is likely to be a positive step, because you’re unlikely to be substituting calories and protein like for like. Most people will consume extra nuts, legumes or other nutritional plant-based food in order to make up any shortfall. These all have just a fraction of the emissions per gram of protein or kcal, compared to cow’s milk.
In practice, this means that switching to plant milk as part of a balanced diet with reduced meat and dairy will almost certainly significantly reduce your environmental impacts overall – whichever plant milk you choose.
If changing diets, it’s also worth remembering that you’ll get different vitamins and minerals from plant milk compared to cow’s milk. For example, soya, oat and almond milk all have more calcium per 100mls than dairy milk. They are also often fortified with vitamin D and sometimes vitamin B12.